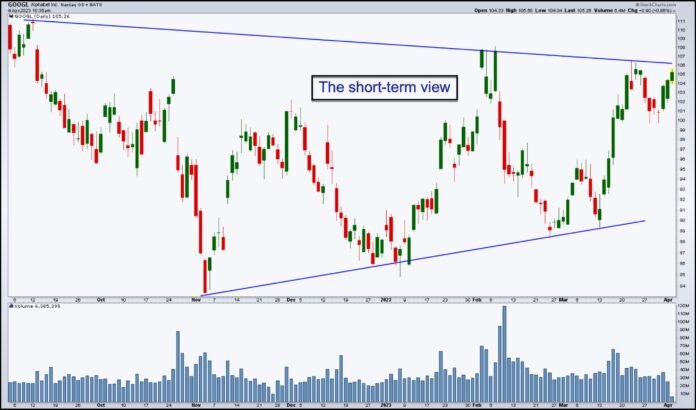

The stock market can feel like a stormy sea, with charts resembling waves and patterns that seem both chaotic and captivating. Technical analysis (TA) aims to navigate these waters by studying historical price movements and chart patterns to identify potential trading opportunities. While not a crystal ball, TA can be a valuable tool in your investing arsenal, but remember, it’s just one piece of the puzzle.
Setting Sail with Technical Analysis
- Understanding Trends: TA identifies trends – uptrends (bullish), downtrends (bearish), and sideways trends (ranging). Recognizing these trends can help you align your buying and selling decisions.
- Chart Patterns: From head and shoulders to triangles, TA examines recurring chart patterns that might suggest future price movements. Remember, past performance is not indicative of future results, so use these patterns with caution.
- Technical Indicators: These mathematical calculations, like moving averages and relative strength index (RSI), can help gauge momentum, overbought/oversold conditions, and potential support and resistance levels.
Anchoring Your Strategy
- Fundamental Analysis: Don’t rely solely on TA. Combine it with fundamental analysis, which considers a company’s financial health, industry outlook, and competitive landscape, for a more holistic view.
- Risk Management: Always have a stop-loss order in place to limit potential losses, and don’t chase hot stocks based on emotions.
- Continuous Learning: TA is a complex skill set. Dedicate time to understanding different indicators, their limitations, and how to interpret them effectively.
Beyond the Basics
- Different Timeframes: TA can be applied to short-term trading or long-term investing. Choose the timeframe that aligns with your goals and risk tolerance.
- Technical Analysis Tools: Utilize online charting platforms and analysis software to visualize patterns and conduct research.
- Seek Professional Guidance: Consider consulting a financial advisor with expertise in TA to complement your understanding and decision-making.
Remember:
- TA is a tool, not a guarantee. There’s no foolproof way to predict the market.
- Combine TA with other analysis methods and manage your risk wisely.
- Focus on developing a sound investment strategy aligned with your goals and risk tolerance.
So, chart your course with confidence!